For part three in this series, I want to talk about inflation and its larger role in society as it pertains to the beer industry and some of the factors that we’ve already discussed. I’m not an economist. I’m just comparatively good at parsing data and paying a lot of attention over long time periods, so you may disagree with my findings here, but my intention is not to reinvent the wheel. What I’m looking to do is describe an arc, if you will.
I want to give you a sense of the shape of the market and how it has evolved over time. We’re going to think about this in the long term, and in order to do that we need referential data points, so it helps to think about this in the way that you’d think about the consumer price index. Price as a multiplicative factor based on some point in the past.
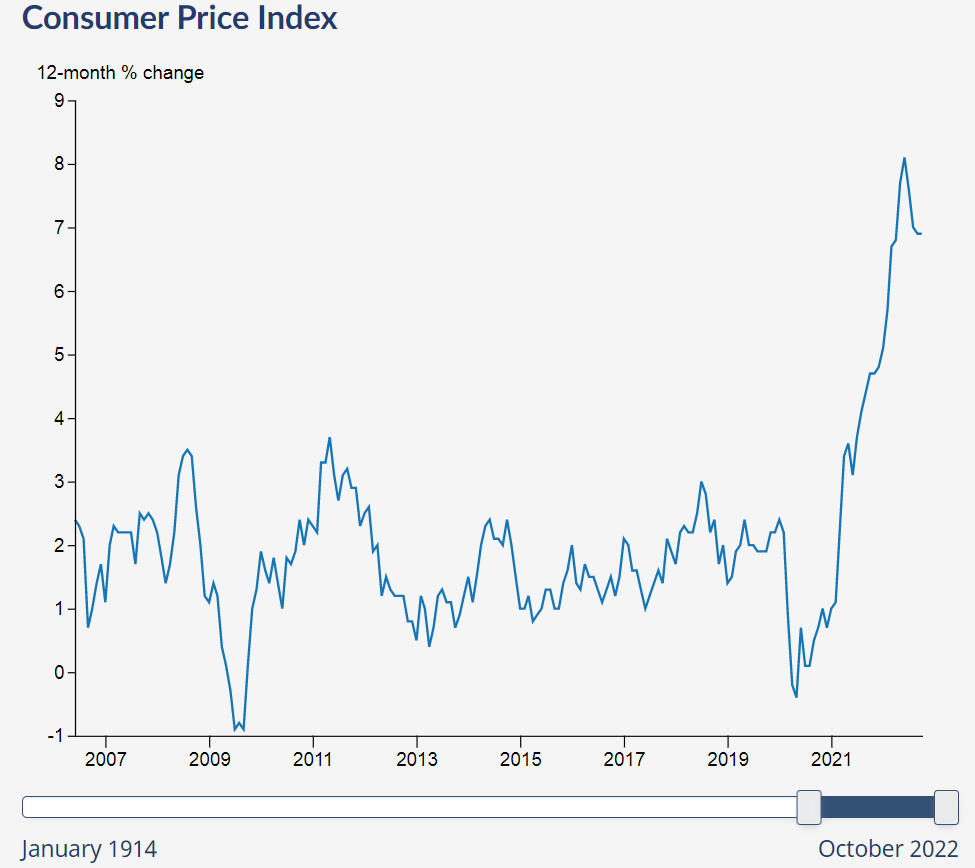
Look at this graphic, just as an example. This is pulled from the Statistics Canada website and simply represents the rate at which inflation has increased year over year over the period 2007-2022. You’ll notice that inflation never goes below 0% for very long. That is to say that the price of goods is practically never deflationary, or at least not during your lived experience.

It’s probably worth noting that the majority of “Craft Beer” as we understand it happened between 2010 and the present day. The other day, I was interviewing Paul Corriveau on the podcast and he pointed out that when Railway City opened in 2007, they were the 37th craft brewery in the province of Ontario. We’re over 400 brewing locations at the moment with a lot of contract entities on top of that. Interest was low, money was basically free, the government changed the excise laws for the benefit of the industry and threw money at the Ontario Craft Brewers.
Our current situation, which you can see as that spike at the end, is being fought with an increase in interest rates meaning that leases and mortgages are more expensive, rates on borrowed money are malleable, and everything costs proportionally more. Throw in global supply chain issues, a labour force decimated by the pandemic, and multifaceted trade wars and you have a recipe for recession.
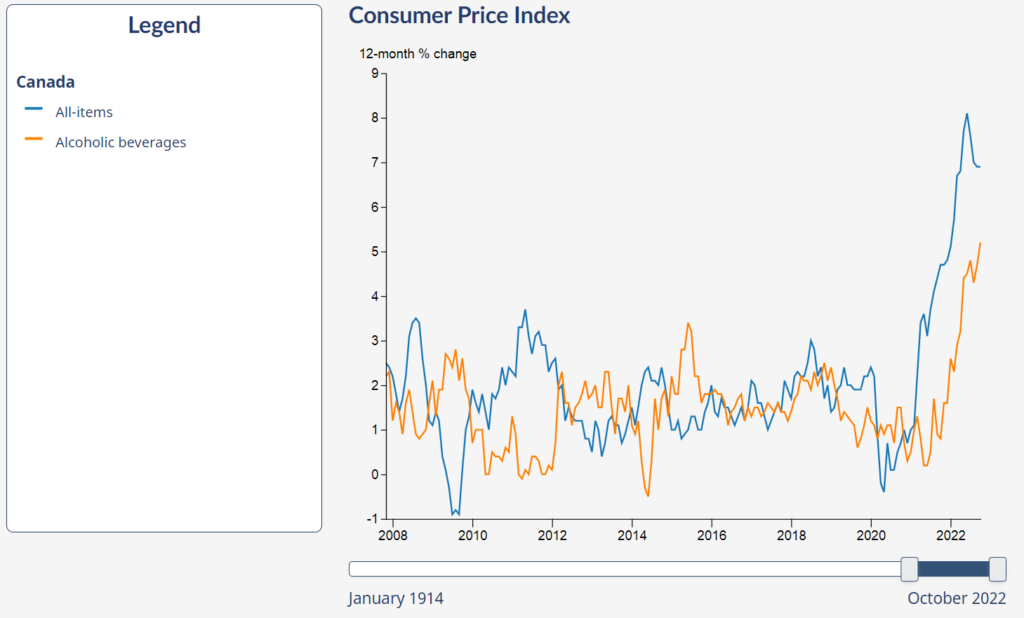
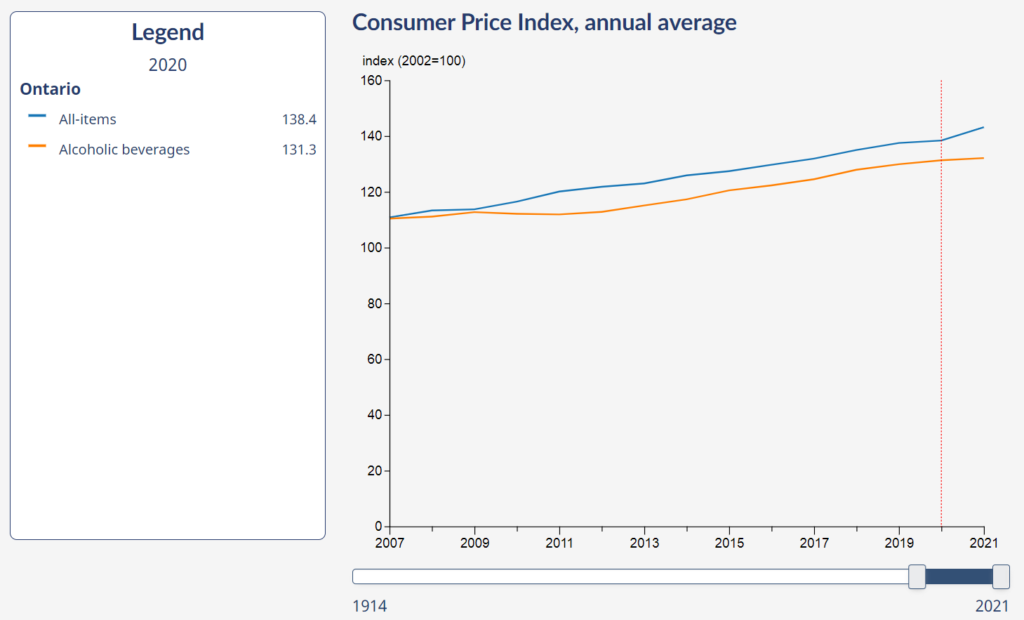
That said, the long term trend is always going to be an increase in inflation and the CPI. Take this second graphic for example. Canada’s CPI measure uses 2002 as their yardstick for understanding the cost of goods. I’m going back as far as 2007 because I think that’s germane for Craft Beer. In terms of the cost of alcoholic beverages, you can see that the price has generally increased by a factor of 1.313 since 2002, which is actually lower than the rest of the goods being tracked by a fairly significant percent.
One of the other things that they track is the cost of alcoholic beverages at retail vs. a restaurant setting. This includes all alcohol, so it’s not a great indicator of the price of a pint of beer. It’s what I’ve got to work with. This chart states the price of a pint in a restaurant is 1.486 times as expensive as it would have been in 2002. If a pint was six bucks in 2002, it’s now $8.91, not including tax and tip. Retail sales are more forgiving. A case of beer should only be 1.269 times more expensive than it was in 2002.
The difficulty is that the index tracks all alcoholic beverages and not just beer. Fortunately, I have some data that I think will be useful: A snapshot of prices from the LCBO website from about a decade ago in March of 2013. I can tell you, for example, that a standard 750ml bottle of Beefeater London Dry Gin was $24.95 and is currently $29.95. It has gone up about twenty percent, which is more or less in line with CPI expectations over that period.
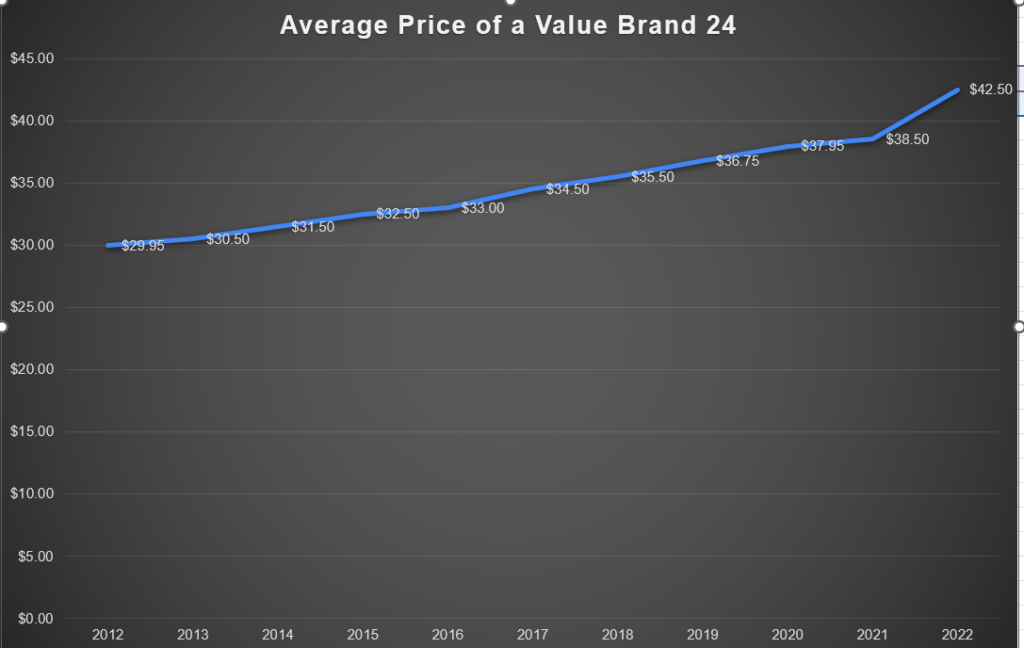
Beer isn’t always retailed through the LCBO, although the price points are standard across retailers. Let’s take a look at the low end of the market. Here’s what price point on value brand beers at The Beer Store looks like since I started tracking the data in 2012. It has gone from $29.50 to $42.50.
The cheapest beer in the market in Ontario has gone up in price by a factor of 1.42 since 2012. Since 2002 when buck a beer was a selling point, it’s a factor of 1.77, which not only outstrips literally everything else on the CPI chart for that period, it has actually increased faster than the price floor escalator the PC government removed at the beginning of their tenure. Remember: retail beverage alcohol in general hovers at 1.269, so the low end of the market was probably underpriced.
For reference, since I’ve not really been tracking the price points on premium products in the same way, I can tell you that Molson Canadian was $34.95 for 24 bottles in march of 2013 and is now $43.95, or about 1.257 times more expensive. Budweiser sat at $38.95 and currently sits at $45.50. It’s 1.168 times more expensive.
Imports are fascinating. Zywiec has basically gone up a dime in the last decade. There’s a reason that segment is growing proportionally. It’s affordable. Massively affordable. DAB has gone from $2.10 to $2.35. That’s a factor of 1.12. Imports are actually massively lower than CPI since 2002.
What about Craft Beer? Well, there weren’t a huge number of 473ml SKUS in 2013. Would you believe only 87 Ontario based 473ml products at that point? It’s just before the sea change to cans happens. These are chosen mostly to illustrate brands that continue to exist in the market.
|
Product Name |
2013 |
Today |
Increase Factor |
|
Muskoka Cream Ale |
$2.75 |
$3.50 |
1.272 |
|
Wellington SPA |
$2.60 |
$3.45 |
1.326 |
|
Waterloo Dark |
$2.25 |
$2.95 |
1.31 |
|
Railway City Dead Elephant |
$2.75 |
$3.35 |
1.218 |
|
Denison’s Weissbier |
$2.70 |
$3.45 (Side Launch) |
1.273 |
It has averaged out to about 1.28 since 2013. Remember that the CPI for the entire alcoholic beverages segment since 2002 is lower than that. It’s worth pointing out that these are all very straightforward beers to make. No haze among them. Low production cost.
The increase in the price of beer over the last decade is proportionally greater than the increase in the price of wine, spirits, and a lot of other consumer goods.
Now, at some point, I’ll talk about input costs, but you have to remember that the consumer doesn’t care about input costs. They just stand in the store and rifle through their pockets for loose change, which is just about what they have left. Median income for people 16 and over in Ontario has gone up about 4,300 bucks since 2013. That’s a factor of about 1.123. During that time rent on a one bedroom apartment has gone up by a factor of 1.394. Food, either from the grocery store or from a restaurant is even higher.
Let’s see if we can recap: Beer is a luxury good by default, and its cost has outpaced wage growth. As established earlier, we’re dealing with the smallest cohort of people turning 19 in living memory, a cohort smaller than any other group younger than 65. Per capita consumption is going down year over year, presumably due to multiple issues including health and lifestyle choices, but also because of decreased relevance due to affordability. Additionally, this is in the face of greater availability in terms of retail purchase locations in the province’s post-prohibition history.


Pingback: The Jing-Jing-Jingliest Thursday Beery News Notes Of All!! – A Good Beer Blog