It’s something of a rarity that I find myself with downtime, but at the moment I don’t have anything on the calendar until about after Boxing Day. This means that I get to indulge myself in some clean up work around the various things that I do related to the beer industry.
One thing that is going to need to happen is some visual changes to the Ontario Beer Map. I’m going to have to figure out how to visually represent companies that have been purchased by other companies. Colour coded ownership groups? Different symbols? Only time will tell. Since I am colourblind and shortsighted, this seems overwhelming and I am therefore procrastinating on a re-design.
That means that for the time being I’m going to focus on the other things that are happening surrounding the beer industry. It’s time to take some measure of where we stand and what’s likely to happen in the near future.
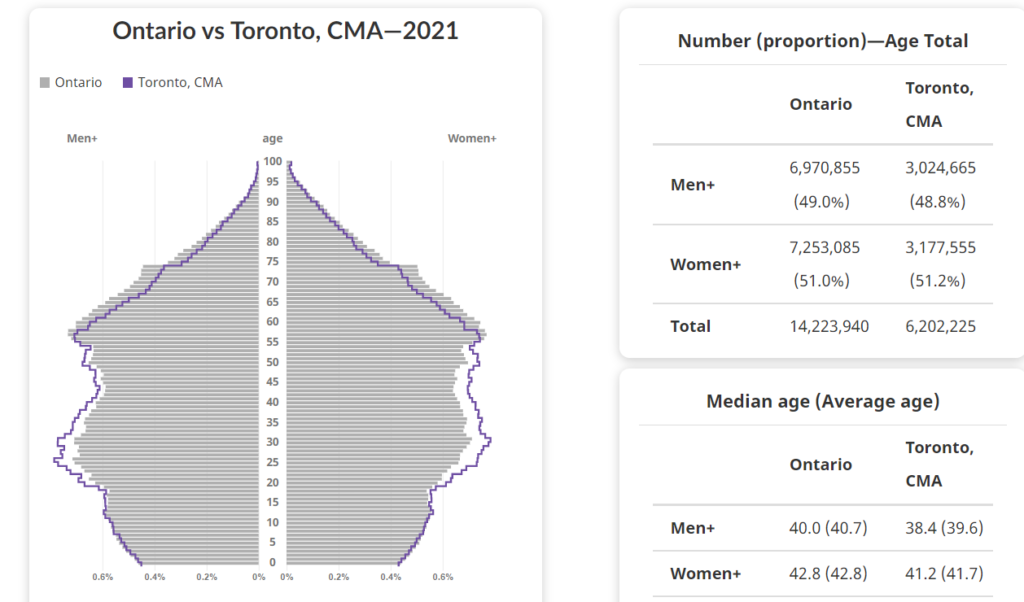
Let’s start from first principles: Beer is about people, and that means that you need to think about the population. We’re lucky to have 2021 census data that will help us outline the shape of the society that we live in. I helped out with generating that data. I’d like you to take a look at this age pyramid, which is pretty useful.
The version that you’re looking at compares the population of Ontario to the population of the Toronto Census Metropolitan Area. That would be the GTA, basically. You can set it up that way for yourself using the handy drop down menus if you want to check my work.
Beer, by and large, is consumed by young people. Molson and Labatt used to refer to 19-35 as your prime beer drinking years. It’s well documented that older people tend to switch to wine and spirits. The thing that becomes eerily apparent looking at this population pyramid is that there really aren’t many young people.
The cohort for 19 year olds, people who are legal to drink for the first time, is the smallest that it has been in some time. 164,150 people turning 19 years old in Ontario. In order to find the next cohort that small you need to scroll all the way up to the 65 year old cohort. The median age of the population is 41.6. It’s the oldest median age of the population in Canada ever.
Every cohort younger than 19 is even smaller than the current one. Immigration is the main driver of population growth in Canada. That means that for the most part, the population swells above the age of 19 as people are old enough and mature enough to emigrate, potentially for education or just for somewhere to live.
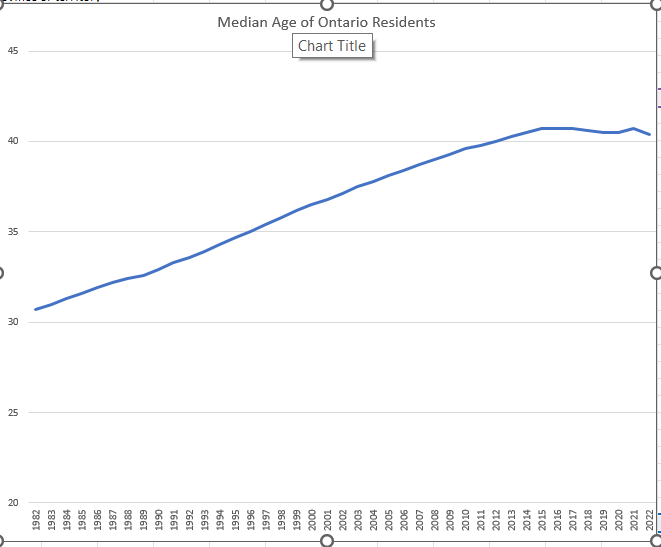
Let’s talk about that median age for a minute. Here’s the data on median age of Ontario’s population from 1982-2022. The median age of the population has increased by 10 years. Here it is represented visually.
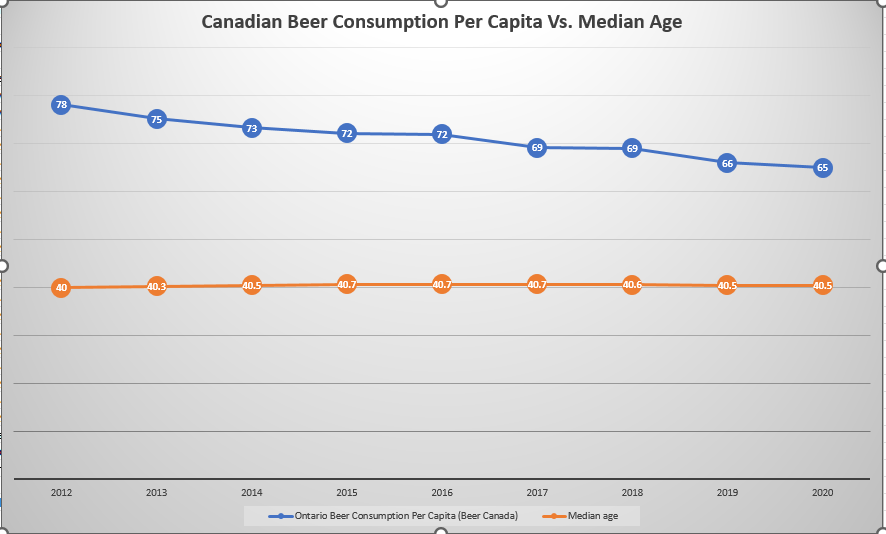
Let’s throw that up against data I have from Beer Canada stretching back to 2012 for per capita beer consumption within Canada.
Beer Canada has not completed their review for 2021. It is typically a document that comes out in approximately March or April and relates this information. Stats Canada, however, put out a brief for National Beer Day for August 8th of this year. It states:
By volume, beer sales declined 2.3% to 2,120 million litres, which is equivalent to 3.9 standard bottles of beer per week, per person of legal drinking age. This was a record low for beer volume sales per person since Statistics Canada began tracking alcohol sales in 1949.
Now, that doesn’t sound good, and I think that we can probably assume that we’re under 65 Litres per capita in Ontario if we extrapolate from that national figure.
This gives us a place to start in terms of analysis. What we have is an aging population that is being bolstered numerically not necessarily through births, but through immigration. We have decreasing consumption of beer on a per capita basis, meaning that the people who consume it regularly are probably well above those who don’t in terms of their consumption.
Over the next few weeks, I’ll be writing a series of pieces building on this information to see if we can’t come to some conclusions about what’s likely to happen over the next couple of years. I’ll be dealing with sales volume, CPI and inflation as it pertains to the population, input costs, competitor products, and the shape of the retail market.
It’s going to be dry. It’s going to be boring. It’s going to be crucial.


Not to nitpick, but I think that census data might be overstating the size of the unborn population a bit.
For your map, maybe do a pin and string design to tie together breweries under the same ownership or otherwise related? That would be fun to stare at for hours.