Last week, I blogged so angry I made the Toronto Star. In 2019. When blogs aren’t a thing.
I’m not really that guy. I just act out when I’m frustrated by incompetence.
This is going to be a little more reflective of normalcy. Did you know I took finite math in university as a bird course and managed a census district in 2016? For an English major who drinks beer professionally, I’m surprisingly data driven. I figured after the blow up last week, I probably owed people something positive to work towards.
Last week, I included a link to a graphic. It was a Statistics Canada pyramid chart from 2017 showing the change in population in Canada over the course of the last 20 years. My feeling is that if you’re going to sell things to a market, it’s useful to know things about that market. I thought I would have a look at demography and break it down for you so that you can see how it relates to the beer industry. It will hopefully highlight the importance of efforts being made to increase diversity in the beer industry.
I’ve sourced information for this post from a number of places including Statistics Canada, The Ontario Ministry of Finance, The Canadian Mortgage and Housing Corporation, Beer Canada, and my own blog from previous years.
I’m going to start really simple. This is the population of Canada since 1970.
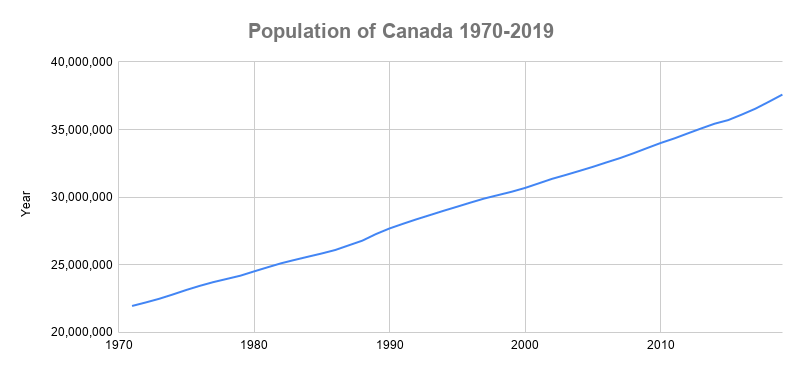
We’re a growing country! This is good news. We have 1.71 times as many people as we had in 1970. That’s great.
Let’s take a look at our local market, Ontario, and see whether that’s similar.
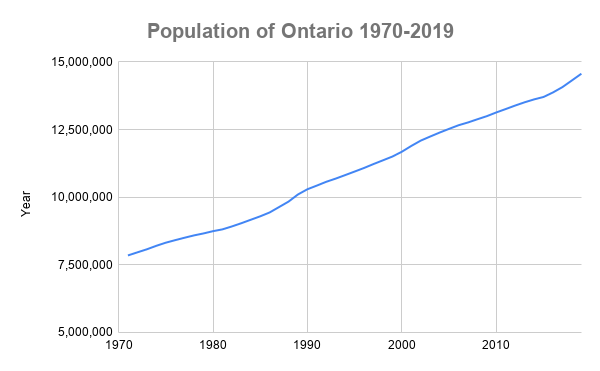
Ontario is growing its population faster than the rest of Canada. This is great, if you’re looking for people to sell stuff to. There are 1.86 times as many people as there were in 1971. We must be selling just a hell of a lot of beer.
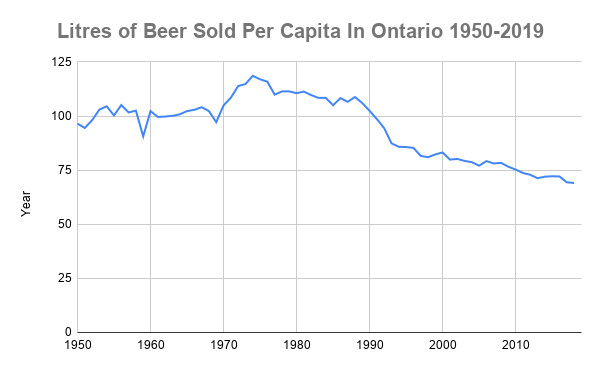
Well, that’s not good. People are drinking less beer per capita than they were at the beginning of our population survey in 1971. In fact, they’re drinking about 35 litres per year less. There’s a real dip there in 1990 that sort of persists forward through time.
Let’s look back at that pyramid from earlier.
Oh, ok. This makes sense now. See that big outcrop in the 1997 outline? That’s the late cohort of the boomer generation in their mid to late 30’s. They are sort of 1946 to 1964. The high point of beer sales in North America is driven by those people. You see that high point in 1974 on the per capita chart? The largest cohort of population ever born in North America decided to go on a bender. I wonder if we can find a data point explaining the likelihood of beer consumption amongst a population. I mean, we seem to have the suggestion that the boomers turning 35 coincided with a massive drop off in per capita consumption.
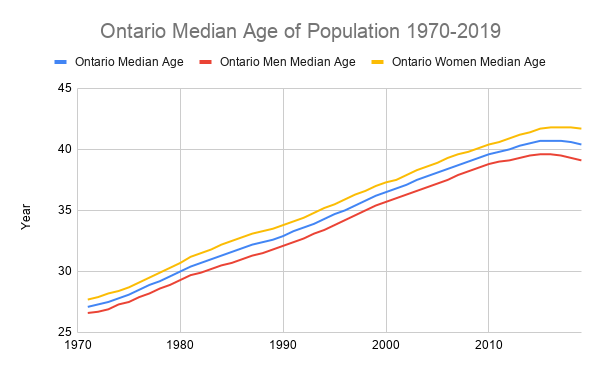
Mmm. Interesting. As the Median Age of the population increases, the amount of beer consumed drops off. Well, that’s good to know. There is a correlation there, but maybe it isn’t a causation. Maybe there are other factors involved. Maybe people have a different presence. I wonder if they’re drinking other products?
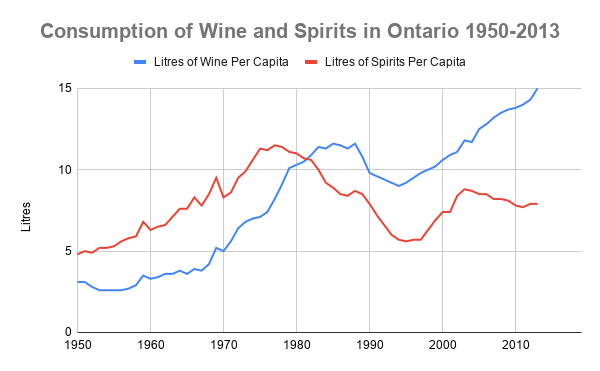
Oh. Well, both wine and spirits are up since 1994, which would be the point when the late cohort of the boomer generation reached their late 30’s. I guess there is probably some truth to the idea that the prime market, statistically speaking, for beer consumption is people between 18 and 35. Also, those 1977 boomers were really putting it away. I mean. Good lord.
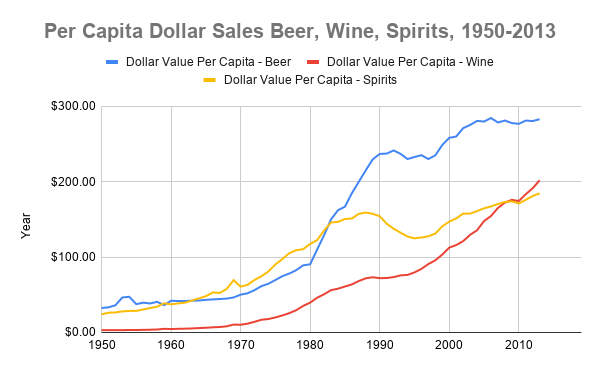
Say. What about per capita spend? You’re a business, you want to know about the quatloos. Just buckets of ducats. Here you go:
We should probably find out some stuff about the 18-35 demographic, eh? You know. Young people. Let’s talk briefly about Millennials. That’s the generation born between 1981 and 1996. Currently, they are between 23 and 39 years old. Let’s have a look at that pyramid chart again. You can scroll up. I’ll wait. See? They’re a little bump in population, sort of an echo of that boomer generation. They are aging at the same rate as everyone else, and the older cohort are starting to age out of that prime beer drinking period. Maybe they’re drinking less, but better. Maybe they’re just switching to wine or spirits. Presumably, though, the leading edge of that cohort aging out of the 18-35 beer drinking territory might have something to do with the per capita volume decrease year over year.
The good news is that there is a generation behind them! Somehow we keep making people! Let’s look at the pyramid chart again and think about Generation Z, which is the post-Millennial generation. Mmm. Oh dear. That 1990’s drop in volume from the beer litres per capita chart? That corresponded with the Boomer – Gen X shift. Both of those groups are still much larger proportionally than Generation Z. I don’t think per capita consumption is going back up anytime soon.
Let’s think about whether there are other factors that play into that. I wonder if the housing market, which I keep hearing things about because of clickbaity BlogTO articles, has anything to do with that. Let’s have a look. Here’s Median Income adjusted for 2017 dollars:
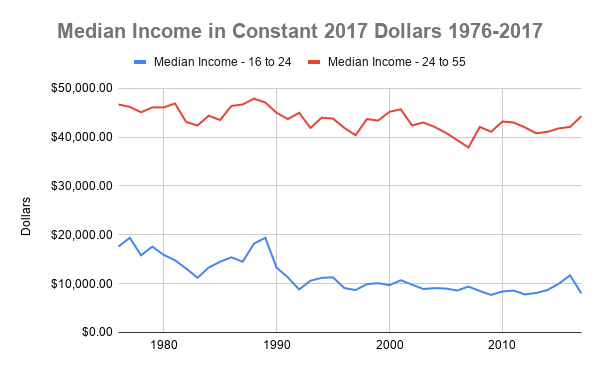
So, adjusted for inflation, buying power has not really increased. However:
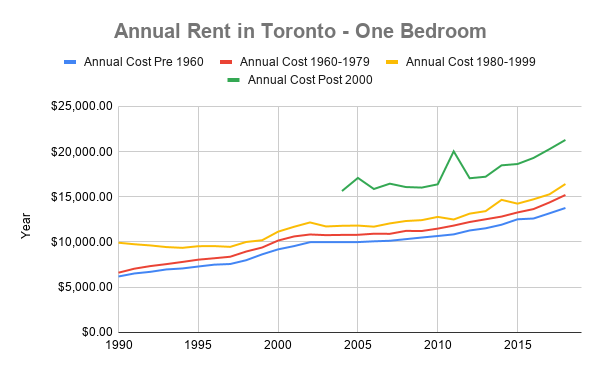
Ok. Young people, who are likely to rent and who are also basically priced out of the housing market, are probably paying more than half their take home toward that. Good to know.
So. To sum up, we have an industrial sector that is decreasing in volume sales year over year despite 257 additional participants in the industry since 2013, the Millennials are aging out of prime beer drinking territory, the people behind the Millennials are few, and they are also broke and stuck in a rental market trap that will continue to get worse.
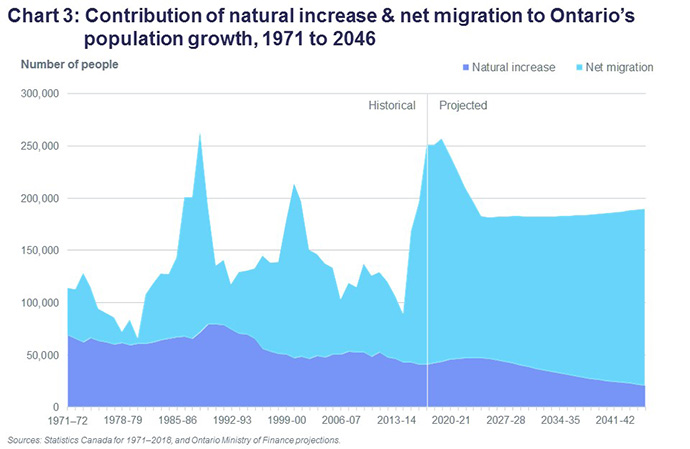
Oh. So, the population is going to increase, but it is going to be 80% migratory. Interesting! And this has been happening since about 1980. I wonder if there is any statistical data that we can look at that might be useful to us in terms of assessing what that looks like.
GOSH! There is. Here is data from the 2001 census which suggests that 4 million Canadians identified as visible minorities. Here is data from the 2016 census which suggests that 4 million Ontarians identified as visible minorities. These nice people represent 29.3% of the province. 3 million of these potential customers live in the Toronto Census Metropolitan Area. The largest groups are South Asian, Chinese, Black, and Filipino.
Hey. What was that Per Capita spend on beer for 2013? It was about 300 dollars a person. So that customer group represents about a billion dollars, potentially. And growing. More than a billion dollars annually. You know those outlying areas of the GTA like Brampton and Richmond Hill? Maybe have a look in the demography in that 2016 census data link.
Now, last week, we talked about not alienating people. And that’s a good policy for retaining the business you already have. However, this is the hospitality business and sometimes that requires outreach to attract additional customers. Representation would be important in this connection. It would be brilliant to make your organization reflect the makeup of the province. Did you know there are grocery stores with beer sales in outlying areas of the city where you can do samplings? Did you know you can hire people who are multilingual and familiar with those territories and that training people on the subject matter is not that hard? There are lots of training programs.
Your survival as a business might depend on it in the next decade, and if you start now, you’ll be ahead of everyone else.
Diversity and a billion dollars. Think on it, won’t you?
I liked your angry blog and I like your reasoned blog. Thanks for both.
Numbers make me all warm and fuzzy. Doubly so when they’re about beer. This is important stuff, Jordan.
You’re a big nerd, Richard.
Thanks for the breakdown(s)… it really is a no brainer! Especially the last line. In blue. About Ren.
Not all growth is good, to blindly embrace growth and diversity is a Corporate tenant not agreed upon by all Canadians!
Diversity could be a benefit for economic or color, it will be a development short term but will be bad in long term most population less job oportunity. Only the neighborn U.S.A. will be satisfaced the job oportunity to develop in Canada. Crime will be increasing in the huge population, it will be necesary more vigilant and more segurity. For example, Gas will be increasing the price, Europe pay 1,49 Euros for liter. Everythign will be more expensive, people will be less richer in the future.